
In this post i will demonstrate two methods for generating Analysis Display Style:
This has been a work in progress for quite some time. Actually, while in the process of developing nodes for the analysis display styles I made some significant improvements to Mantis Shrimp Brep Node as well as added Extrusion, User Strings and Face Center nodes. A full preview of Marker and Text Display Style can be seen below:
If you were patient enough and watched the entire 20 min of this preview (I know it was a bit long but there is quite a lot to cover), then you have a good idea about what it takes to set up the Marker and Text Display Style using Grasshopper and Dynamo. In this post I will briefly focus on another style that I was working on called Colored Surface Display Style. This Method will allow us to generate something like this:

The idea for this came from Mostapha (father of Ladybug) who asked if it was possible to transfer results of Solar Analysis done in Grasshopper with Ladybug to Revit via Dynamo? At first I was a little skeptical, but then i found out about Analysis Display Framework in Revit and I was off to the races. Of course it was not very straight forward since Revit API has very little support for meshes and even less(actually none) for mesh vertex colors. The way this was achieved is via extracting points from mesh and then projecting them onto a surface in Revit to generate UV coordinates, that in turn can be used to generate analysis surface seen in the image above. Let’s get to it:
- We started with the idea to transfer Mesh Vertex Colors but eventually realized that it was not possible to color meshes in Revit. Then we decided to transfer actual analysis results and just attach them to mesh surface as User Strings. User Strings allow you to attach any combination of Value and Key (both as strings) to a piece of geometry in Rhino or Grasshopper. It was actually really simple and required three lines of code:
- Grasshopper component – Mantis Shrimp User Strings – can be downloaded here: GitHub.
- Grasshopper component – Mantis Shrimp Export – can be downloaded here: GitHub
- Ladybug components can all be downloaded from Food4Rhino
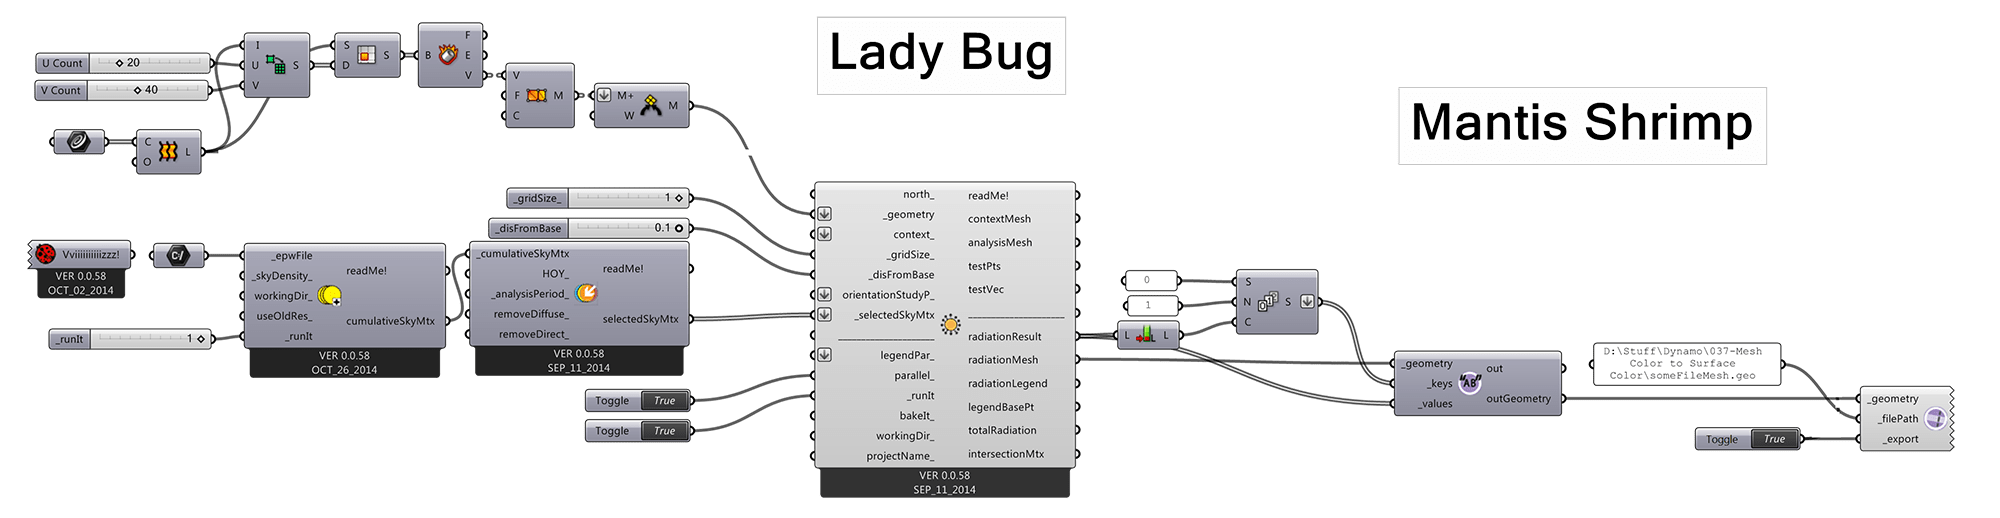
- Below is a Grasshopper definition to divide surface:
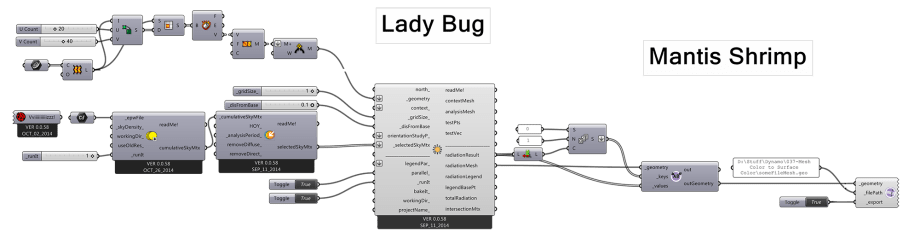 This will write our mesh and all of the needed strings with analysis values stored in them. Now we can open up Dynamo and use Mantis Shrimp nodes to extract that information:
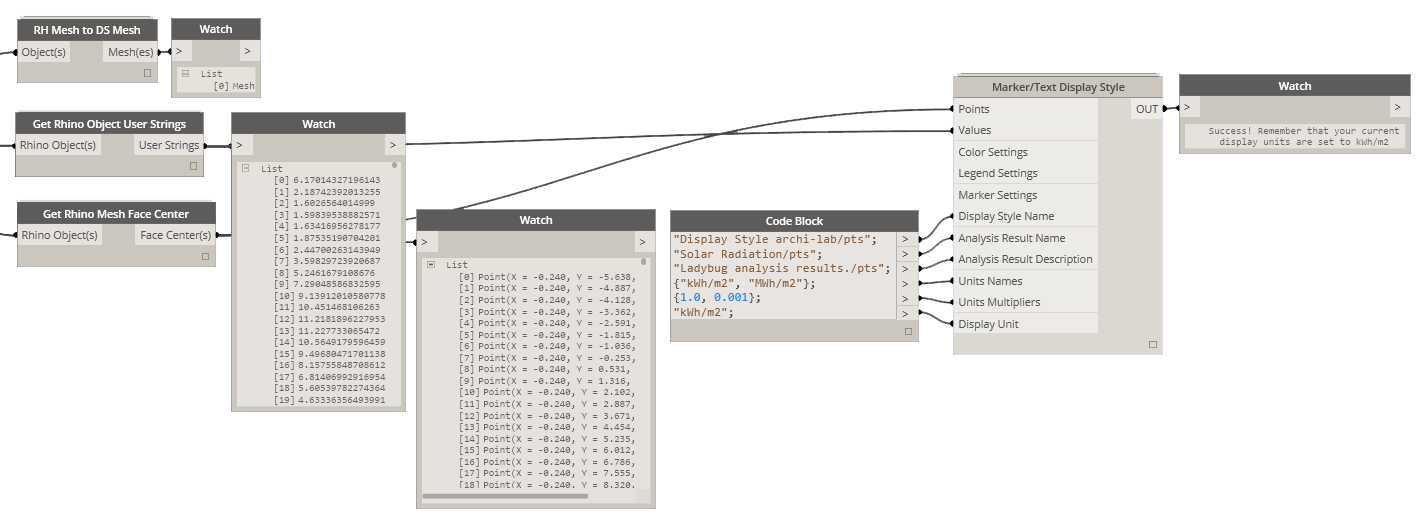
 Here you can see I am using three different nodes to extract information that i need. In reality I don’t need the RH Mesh to DS Mesh node but I am using it to visualize better the surface that I am dealing with. Get Rhino Object User Strings node will get us a list of user Strings with the analysis results. Get Rhino Mesh Face Center will extract points at the center of each face of the mesh which we are going to use to visualize our data. Please remember that I am using a Mantis Shrimp node here to get face center points instead of for example using native Dynamo nodes to get those from the translated mesh, because when that mesh gets translated for some reason topology of it changes and list of center points would no longer match the order of values. When I extract those from the Mesh using Mantis Shrimp nodes i am sure that those two lists match up perfectly.
- Next thing we can do is start to set up our Analysis Display Style. What we are using here is your standard Revit Analysis Visualization Framework that you probably saw with Vasari Solar Analysis. Instead of setting it all up using Revit interface I made a few components for Dynamo that will let you set up everything right in Dynamo. All settings and inputs are explained on my Download Page.
 Again, Points and Values are coming from the Mantis Shrimp nodes. Color Settings, Legend Settings and Marker Settings are explained on the Download page. Here’s a quick snapshot of how i had them set up:
- Legend Settings:
 Color Settings:
 Marker Settings:
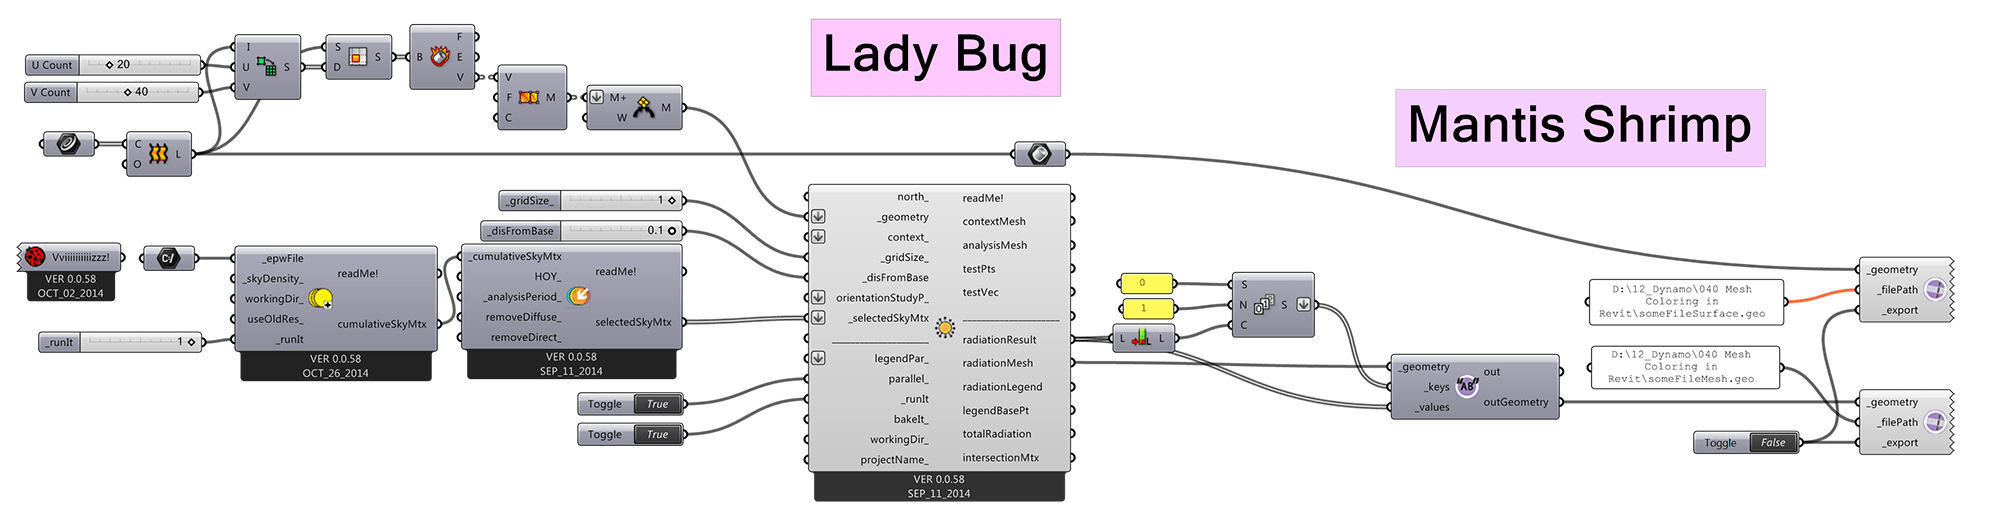
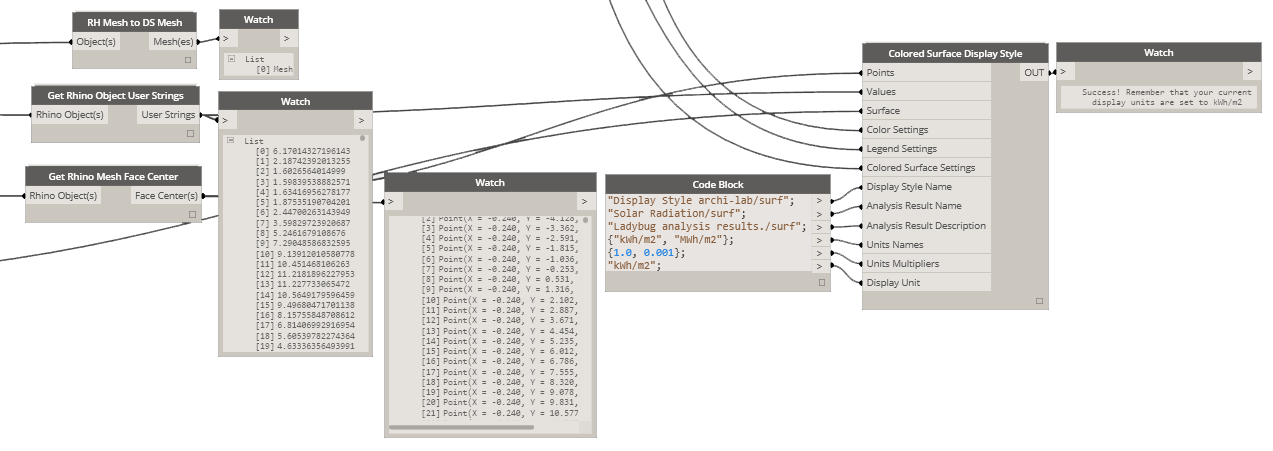
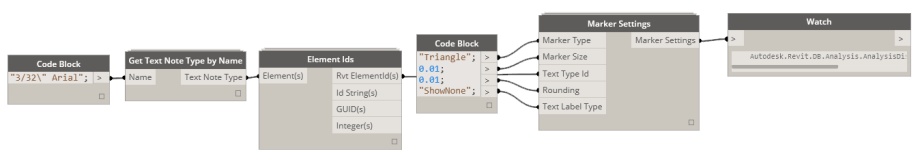 Another thing that you can do is use the Colored Surface Display Style to create a visualization that we are all much more familiar with. This node has an additional input of a Surface because it needs a reference surface in Revit that it will use to create a visualization surface on. To do that we are going to use Mantis Shrimp again to export both a Surface and Mesh from Grasshopper and then import that surface into Revit. Here’s Grasshopper side:
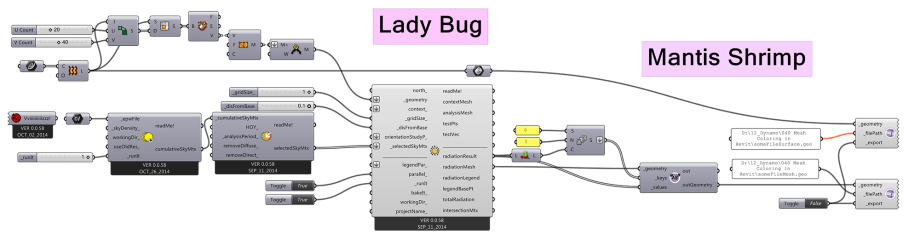 On this one we will need to make some small changes to our Dynamo import layout:
 Color Settings, Legend Settings can remain the same so please see above. One more thing that changes is that instead of using Marker Settings we need to define Colored Surface settings and then apply them to Colored Surface Display Style:
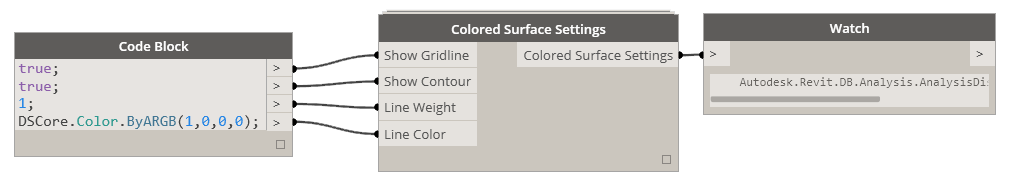
- Colored Surface Settings:
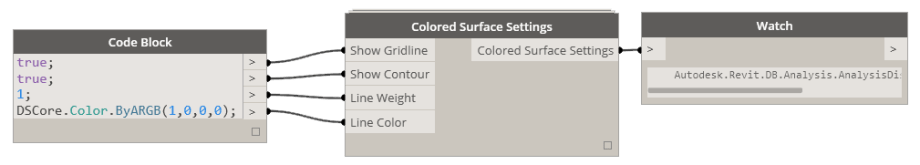 Colored Surface Display Style:


With this you should be able to get a basic surface analysis display from Grasshopper Ladybug into Revit using Dynamo and Mantis Shrimp. I will keep working on these methods as there are quite few to explore as well as other geometry types. I want to make sure that breps and more complex geometries work reliably. If you have any suggestions, please do not hesitate to shoot me an email. I am open to looking at files for better case studies.
Good luck!


Trackbacks