
The intro
This has always been a fun question to ask when reviewing Revit models. I remember back in my HOK days, we even coded up a little tool trying to keep track of the growing number of warnings in the project. However, when it comes to knowing “who” created any specific warning, it was always a question mark. That’s because if you open the Warnings dialog, you can see which elements are associated with what warning, and you can track these elements down, but the Worksharing Tooltip tool will give you info about the last person that edited it, which is not always the actual person that created the warning. As a matter of fact the Tooltip info gets set to a single person for all model elements when that person re-creates the central file. That’s a bummer. The entire history of who touched what is erased when you do that. Some time ago, I tried tracking who creates warnings in a file, by capturing how many there were when the file was opened, and then comparing that to how many there were when the file was closed. That was a pretty decent way to track if someone has resolved some warnings as well. I might go back and implement that for Bimbeats one day too.

The how
At the moment however, you get to see information about every Warning when it was created in real time. You also get that info combined with what kind of warning it is, whether it has resolutions, whether it has any elements associated with it as well as context of the file that it was created in: file path, file name, project id or project name. The fun part of this is that data is populated in the database in real time, and you can react to it using Watchers to send emails or Teams messages. If you really have some “no go” Warnings that you know for a fact will cause issues with the model (think stair top end exceeds or cannot reach the top elevation of the stair…), you can easily notify model managers about these issues before they even get saved in the model. Obviously everyone will have different “no go” warnings, so Bimbeats allows for assignment of severity ranking to each warning. That way each warning will be categorized, and you get to choose which one’s you care about the most, and which ones can be safely ignored for the time being.

The why
Before we get into this a little deeper, I wanted to make sure that we are clear on why this might matter for BIM Managers, Specialists or anyone else responsible for maintenance of the models and staff training. On the model maintenance side of things we all know that warnings are bad for the model. But why exactly is that? From my findings, it’s because they add extra time to Open events. That one is obvious. They don’t exactly bloat the file size, since definition for warnings is not stored in a file. It’s re-created for every warning when the model is open, and then again, when you open the Review Warnings dialog. Because of that you don’t exactly see a spike in file size when your warnings spike, yet the file is slower. The other aspect of it is training. How much better would it be to know exactly who created that pesky stair warning that we know will cause issues in the file? Wouldn’t it be awesome to target your training to people that continually generate a high volume of warnings, rather than drag in people that don’t? You don’t have to call people out, but you can encourage them to participate in specific training sessions based on actual data. Of course, this information can also be used to reward people for doing a great job. What about staffing? Wouldn’t it be nice knowing who is really good at creating quality Revit models before you staff the next job?
Here’s some small training conclusions/ideas that you could be drawing from certain warnings and their frequency. Let’s take a simple “Constraints are not satisfied” warning. It happened 537 times in the last 7 days for a company of 100 users.

That warning might be an indication that people are struggling with creation of parametric content. This warning usually occurs in a family editing context. Why not put together a parametric modeling course for the top 10 people on this list? A single person on this list accounts for 30.5% of all of these warnings in the last 7 days. It means that, that one person is doing a lot of content modeling. Maybe doing some one-on-one with that particular person is worth the effort. There are some other family editing warnings that might be worth looking at as well, that might paint a different picture. Things like:
- One or more dimension references are or have become invalid.
- Constraints between geometry in the family can behave unpredictably on parameter modification. To make the family reliable, constrain geometry to levels, reference planes, or reference lines.
- The constraints of the sketch defining the highlighted element cannot be satisfied.
- Reference Planes are overconstrained.
- The References of the highlighted Dimension are no longer parallel.
- Extrusion is too thin.
- Line is too short.
- Lines must be in closed loops. The highlighted lines are open on one end.
- Line in Sketch is slightly off axis and may cause inaccuracies.
- …
That list of Family related warnings can go on and on. The nice thing about Bimbeats is that you can see whether a warning was created while in a family (rfa) or in a project file (rvt). This allows you to interpret warnings that might occur in both environments differently. For example, if I see “Line in Sketch is slightly off axis and may cause inaccuracies.” happening during “Paste” operation, I am immediately thinking that someone is pasting linework that might have been an exploded AutoCAD drawing. A quick look at data from this company reveals that in the last 90 days they had 9,605 family (rfa) editing warnings. The highest warning creator from previous 7 days, is also one of the highest warning creators in the last 90 days with over 20% of total warnings. Again, it’s not an indictment. As a matter of fact, this could be your content creator, and you are fine with that result. That’s great, with Bimbeats you can exclude certain users from your analysis and focus on people that simply might need a little training or guidance.
Other uses
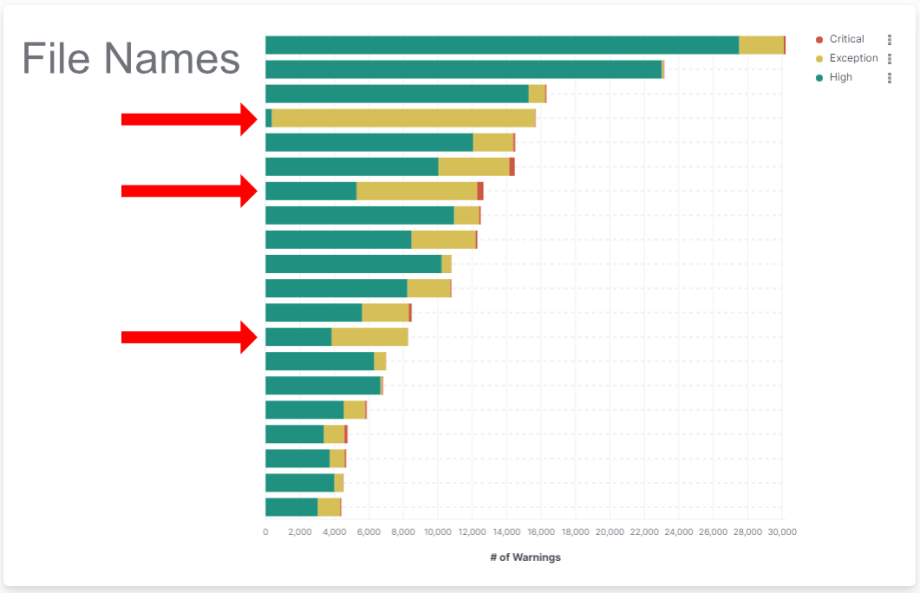
You can also use this information in a bigger context. For example you can create visualizations that break down warning creation per file and see which files have the most warnings created for them. Please do not mistake this for which files have the most warnings total. That’s because this particular warning data is accumulative and doesn’t account for warnings being resolved. What I mean by that, is that when a warning is created a data point is posted to the database, but that same data point is not removed from the database when the warnings is resolved. That’s why I would use this data to watch for trends, not as an absolute measure of model health. Here’s an example of a breakdown of warning creation in the last 90 days by file name.

The cool thing about this kind of graph is that you can see for example what kind of “effect” on the file the end of the dealing sprints can have. I have often been a part of projects that when they approached a SD/DD/CD deadline, tons of new people were added to the project, and started to “create” content in that file. All of a sudden file sizes would grow to some massive amounts, with tons of linework and unused working views added to the file. Besides people that were not actively on the project, were often taking shortcuts because they knew they wouldn’t be on that project long term.
Sometimes, I think adding people to the project a week before the deadline was a net negative for the project even though it resulted in some extra details or elevations being added.
Konrad
I often argued to make sure that people added to the project for a short term boost, were only used for some low level tasks like picking up red lines, or spell checking comments etc. Anyways, with a visualization like above, you could easily do a quick analysis of that period in time and see how many warnings these new people created. It would be fun. In the specific chart above you can see that on one particular file that is at the top, only three people created warnings in the last 90 days. That would tell me that this project has 3 people working on it. Two of them respectively created 15,383 and 12,929 warnings. That’s a lot. Again, that’s not to say that the file has over 28k warnings. It probably doesn’t, but that’s to say that these two people create a lot of warnings.
You could also flip that visualization and look at total warnings created by user, excluding project associations. You never know, when the worst performers are lending their helping hand on multiple projects. :-)

Again, for this company of 100 users, we are getting some clear delineation between the avant-garde of maybe top 8 user with more than 10,000 warnings created in the last 90 days, and everyone else.
You could also look at a breakdown of files, with warnings of Critical or Exception level of Severity being created, as a proxy for trying to estimate which files might need more attention. Unfortunately this particular setting out of the box is a little underdeveloped. Most clients opt to stay with the default assignment of severity that we gave various warnings, and I have to shamefully admit that we did not do a great job with that by simply assigning a value of High to all Warnings that were not raised to a status of an Error or a Document Corruption. Yes, for warnings in the file that Autodesk categorized as Document Corruption level warnings we would assign a Severity of “Critical”, and then Error level warnings would get a score of “Exception” from us. Here’s a pretty scary chart though that shows that some files have awfully lot of errors and document corruption level warnings created for them.
Obviously we also collect data about warning counts in the file, not just instances of users creating warnings. Using that data you can easily identify which files have the most warnings.

As you can see above some of the files do have a high count of warnings, but nothing outrageous. You might even ask how did we get to 10,000+ warnings being created by users that I was showing in previous graphs. Like I said, previous charts were showing warnings that were created in files, not ones that might necessarily get saved in that file. This table shows the actual saved warnings which are going to be there the next time you open that file. Your users could be unloading links which host walls that were used to bound rooms, and that will create a lot of warnings in that particular moment, but next time you save with that link loaded, these warnings will not show. They would show up in warnings created, and over time if that’s the standard behavior for users then it will add up.
Be careful from jumping to conclusions too quick. That data is only as good as the person interpreting it. If you are not sure about something, go talk to your end users. They will likely have a decent explanation for why they are doing things they are doing.
Konrad
Is there a solution?
Well, is there a problem in the first place? If you do think that some of the warning generation behavior is troublesome, then certainly there can be solutions devised to address some of these issues. If you think that fixing Room Separation warnings overlapping with Walls is a problem, then there might be a quick an easy solution to that using a plugin that can scan the drawings and clean these things up, or flag them for you to make decisions quicker. If you think that warnings about walls being slightly off axis need to be addressed, then you could write a plugin in Revit that would correct them and eliminate the warning. It’s all a matter of identifying things that you think are problematic, and then deciding whether the cost of time to address them is equivalent to the benefit that it might bring. Sometimes it might not be if you are going to try and fix these warnings manually every time. Maybe it would make sense to try and automate fixing of them, especially if it’s a low hanging fruit.
The plug
Now is the time for a shameless plug. Two things:
- First, this analysis and many more are possible with a tool like Bimbeats. Go check it out at Bimbeats.com. If you like it, reach out to me, and I will be happy to schedule a demo with you. Here’s my calendar.
- Second, I am proposing a tool here, but unfortunately at the moment, it’s just an idea. Since I work as a consultant, and a software developer, if you think you would be interested in a tool like that, perhaps we can build it for you. Drop me a line at konrad [at] archi-lab [dot] net.


Trackbacks