
As some of you might have heard by now, my friends at Bad Monkeys and I have launched a little tool called Bimbeats. The idea behind it is simple:
Capture, analyze & automate your organization’s AEC data in real-time.
What we capture is data from your favorite AEC tools. We started with the good old Revit, and moved on to things like Dynamo, Navisworks, AutoCAD and are currently testing Rhino and Grasshopper.
You might be wondering what kind of data we are capturing. Well, for Revit, it’s the good old open times, synch times, element counts, etc. The list is quite long, so I won’t go into it in detail, but I will mention that aside from what is in the model, we are also parsing Revit’s log files (also called journal files). We are able to catch additional data from that source, and if you are familiar with Revit’s logs, they have lots of meaty stuff in there that will allow you to fully understand the state of your digital assets and behavior of users. As a bonus, we are not just doing Revit. Imagine getting all of the data about your Dynamo scripts, Grasshopper scripts, CAD files, Rhino files etc. The more pieces of software we add, the more you will understand your company’s digital footprint. Not just one little part of it, the whole of it.
Now imagine that you can do it in real-time. The idea here is to capture all of that data “on the go”. There is no “export to Bimbeats” button. You work just as always, and we do our magic behind the scenes.
What can you do with all of that data? Well, lots of things. Actually, I don’t think there is a single recipe ie. “the recipe”, that will fit all companies out there. That’s the idea. We don’t want to tell you, what to do with it. We are interested in allowing you to come up with your own questions. We are here to give you the tools that will back your stories with data. We are here to help you understand it, and visualize it. At the end of the day, this is your data, and your story.
When I was at my previous company – HOK – I had a great privilege to work on a tool called Mission Control. It was a tool tailor built to capture and visualize data from Revit models. The idea was very similar to what we are discussing here. The problem with it was, that at the time, I didn’t realize that I made myself the master of that data. As a developer of that tool, I put myself in a position to analyze the data we were collecting, and create compelling visualizations that would tell the story that I thought would best represent potential issues. Fast forward two years, and I realized that it was a wrong approach. I didn’t want to be the funnel that everything flows through. Instead of making that tool better, I was making it worse. I was preventing users, from asking their own questions, drawing their own conclusions, creating their own dashboards and visualizations. I was preventing poeple from understand their own models from their own perspective. Bimbeats, is the next step in that process. With Bimbeats, I am no longer in between users and their data. Anyone is allowed to dig in. Anyone is allowed to explore. Anyone is allowed to ask their own questions and seek their own answers.
Let’s have a look at a potential question that someone might ask. For now, I will have a look at Dynamo, and in the future I will do a few of these for other software that Bimbeats supports.
Let’s say that you deploy Dynamo to users with a list of Packages that you think are critical to take full advantage of the tool. How do you know, that the packages that you deploy, are the right packages that people actually use, as opposed to packages that are slowing down their experience of the software that get very little burn. What if you could track how much nodes from these packages are being used, in real-time for the whole company?

Looking at the above chart, I could easily consider getting rid of Bumblebee and perhaps Mantis Shrimp. Why deploy these to the whole company if no one seems to be using them much? With this knowledge you can shave valuable seconds of time that it takes to boot up Dynamo, execute your Dynamo Player scripts or simply execute searches inside of Dynamo. Remember famous quote from Mies van der Rohe: “Less is more”.
Let’s try a different question. Let’s say that you have a trove of “approved” Dynamo scripts that you made available via a shared network drive to all users in the company. Wouldn’t you want to know how much “burn” these are getting?
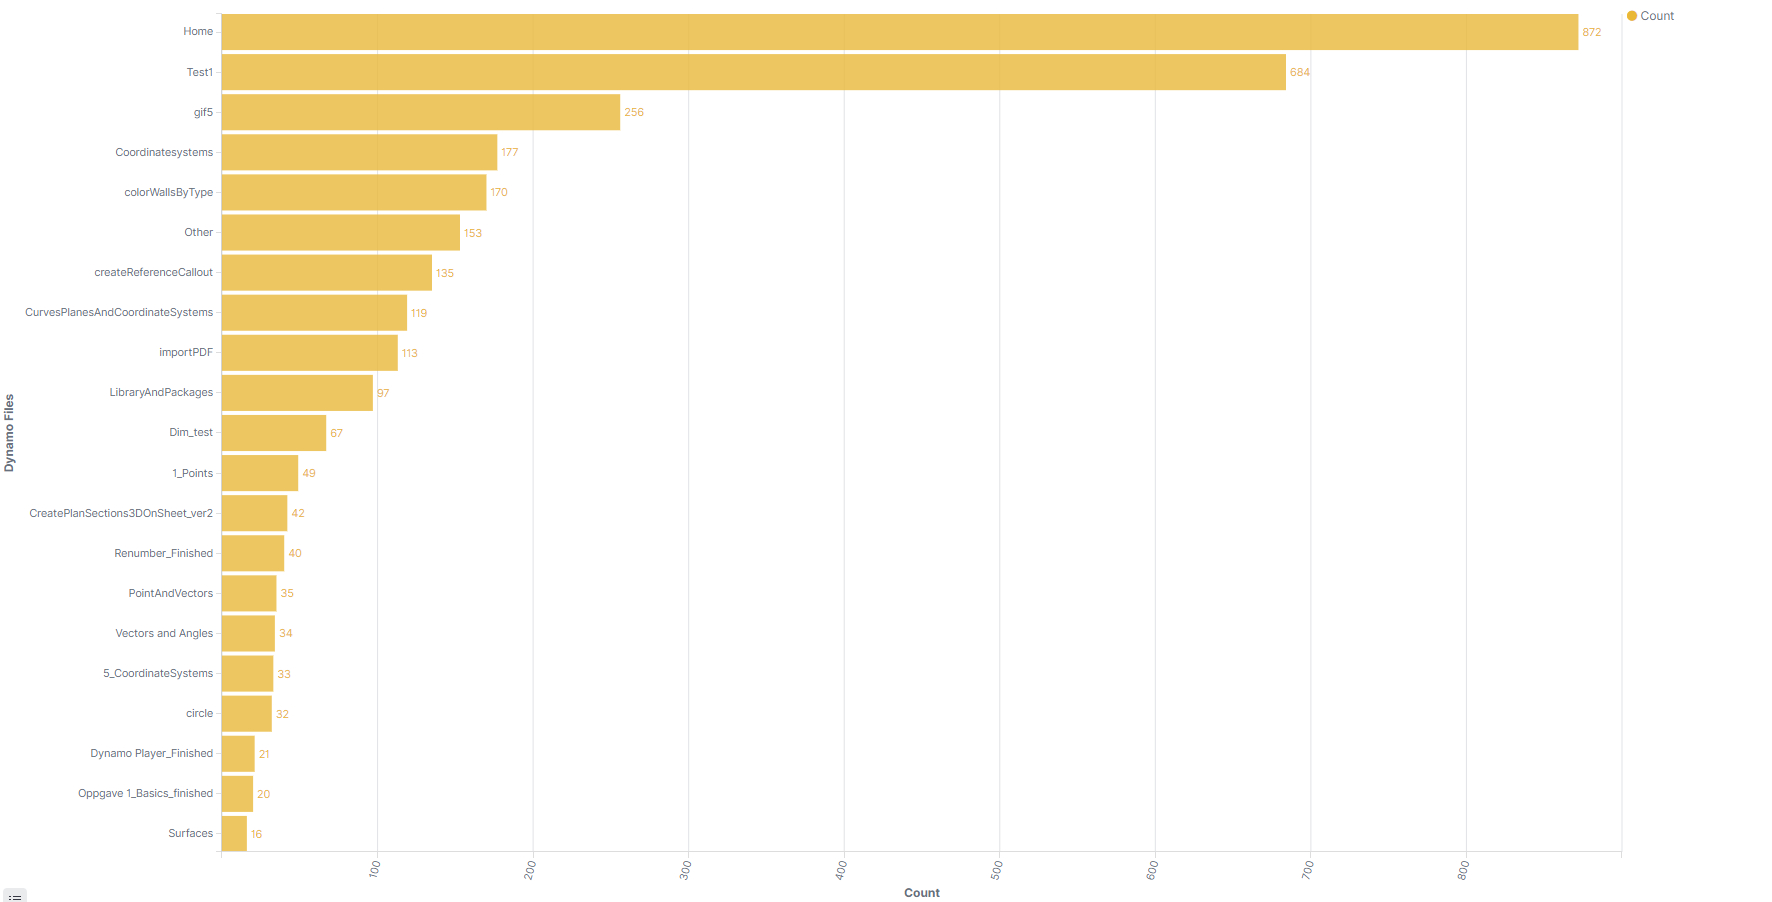
Having ability to quickly see which scripts are actually being used, and how much would allow you to dedicate time to those that are helping others. For most companies, being able to focus some of their most valuable and expensive resources (their computational design folks) on things that are actually being used, means huge savings. Knowledge is time, and time is money. Don’t waste your time upgrading, and maintaining scripts that no one is using.
Now that you know what scripts are being used, wouldn’t it be nice to know who’s using them?
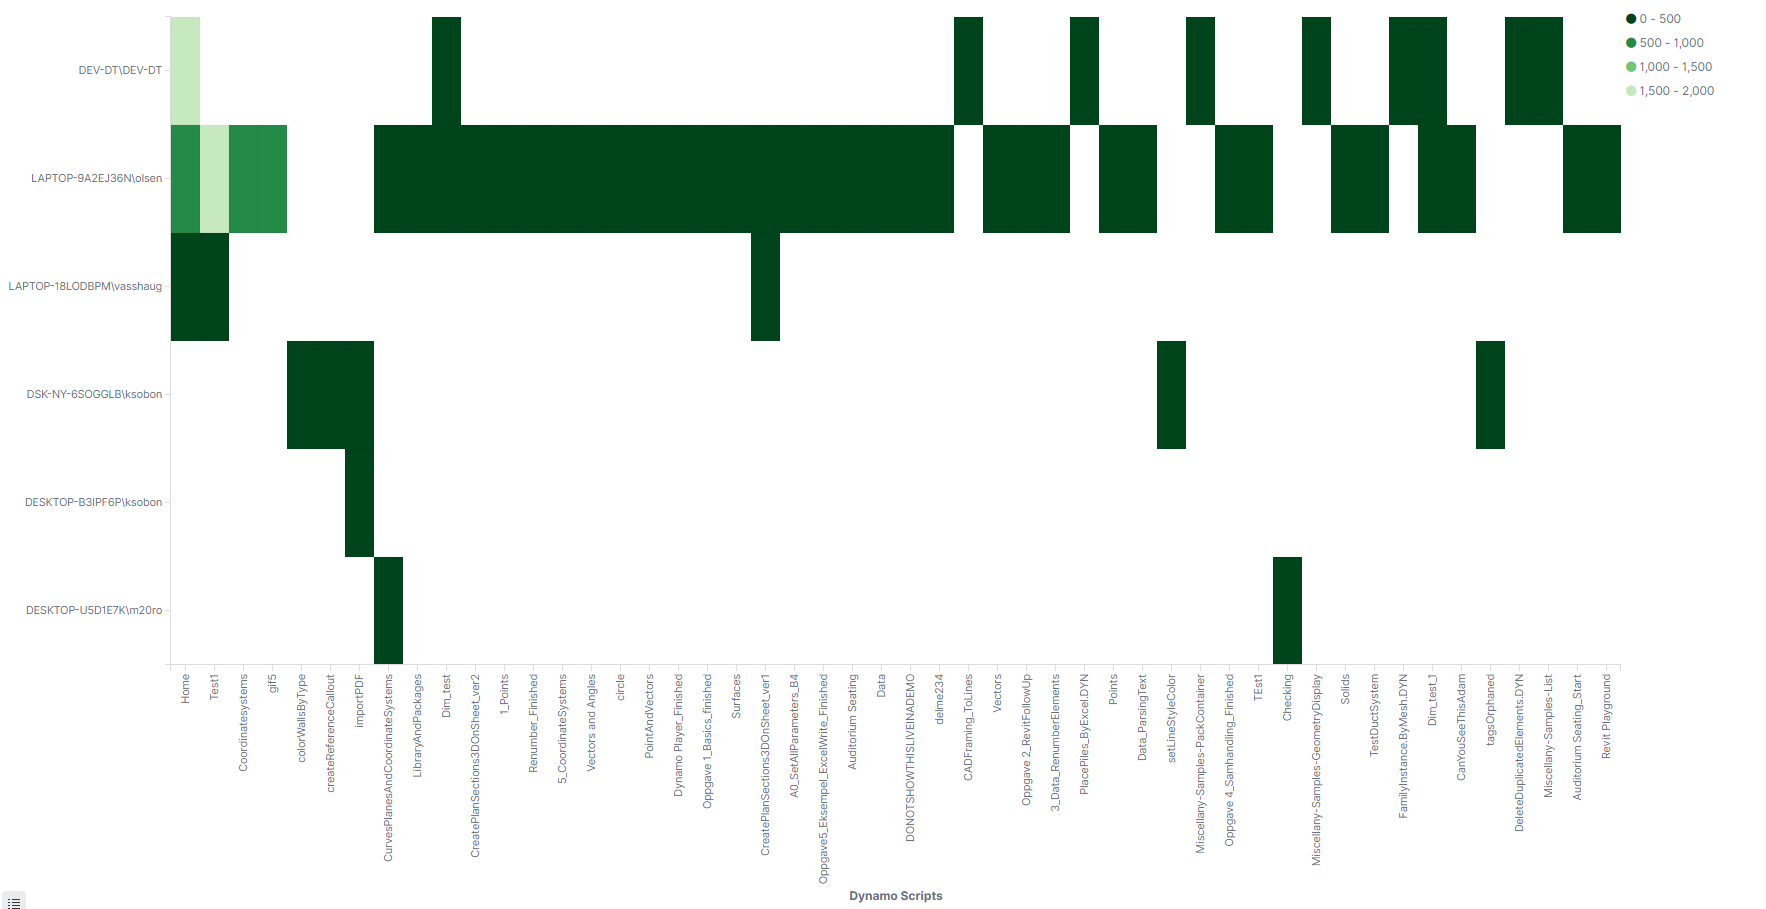
You are investing time and money to create, maintain, and deploy these scripts. You spend time and money training your staff to be able to use them. It only makes sense to find out who is fully taking advantage of all that time and money spent on your digital assets. With this kind of data, you can easily pick their brain for potential improvements, but also figure out who might need some extra training and encouragement.
Let’s do one more. What if you organized an “Intro to Dynamo” workshop? The idea is that people that attended it, would take the lessons you were teaching, go back and start applying them. Wouldn’t you want to know if your workshop resulted in actual uptick in Dynamo usage among attendees, or did they just sit through the class, and went back to do their “business as usual”?

If you knew you were running your workshop in October, then you would easily be able to evaluate its effectiveness. Not only you would be able to see the usage spike in the following weeks/months, but also see if what you were teaching “stuck”. The uptick should become a norm, not just an aberration in the data.
These are just some of the questions you might be asking, and only about one of the pieces of software that we support. With Bimbeats you can now ask these questions, analyze the data, visualize it, and share your results with others.
We are just getting started. Revit and Dynamo were first, but we are already working on Rhino and Grasshopper. Navisworks and AutoCAD are already in beta phases. Soon enough we will support any software that you might use at your company, and you will be able to finally get a full picture of your digital footprint.
In the future posts I will take a closer look at some of the other questions you might want to ask. I barely scratched the surface of the things that you can do with Bimbeats. We haven’t talked about dashboards, reports, notifications etc. There is so much more to Bimbeats that I can manage to mention in a single post that it only makes sense to spread it over time.
To find out more about Bimbeats, our pricing or to schedule a demo, please head over to www.bimbeats.com.
This is a new adventure for us, so if I left something out, or didn’t explain something properly, feel free to leave us a question below, and I will try and get back to you.
Cheers!


